Tutorial
We are going to build one figure from nothing: a small architecture diagram with a title, two panels of text, a bar chart, an arrow and a logo. By the end you will have written no coordinates.
Everything here runs as a plain script. Put it in figure.py and run it with python figure.py after each step.
1. Install
.svg and .pdf output need nothing else. For .png, add the raster backend:
2. The smallest figure
A Doc is a figure under construction. It takes a width and nothing else — the height is what we are trying not to have to know.
from svg_plus import Doc, Text

doc = Doc(600)
doc.add(Text("Hello from svg-plus."))
doc.save("figure.svg")
Open figure.svg. It is 600 units wide and just tall enough for one line.

Units, not pixels
svg-plus never says "pixel". A figure is a coordinate space, and the SVG carries a viewBox, so the same file scales to a column in a book or a slide. Pick a width that matches where the figure will land — 600 for a text block, 842 for A4 — and think in those units throughout.
3. Text that breaks itself
Give it a real paragraph and ask for justification:
from svg_plus import Doc, Text

BODY = (
    "The market grew sixfold while European suppliers grew only threefold, "
    "so their share falls from 29 % to 15 % — which is easier to draw than "
    "to say."
)

doc = Doc(600)
doc.add(Text(BODY, align="justify"))
doc.save("figure.svg")
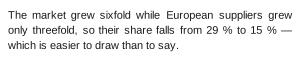
The paragraph is broken by total fit, and the figure got taller by exactly the number of lines it needed. Change Doc(600) to Doc(300) and it gets taller again — you did not have to tell it.

At half the width, without touching anything else:
align takes left (the default), center, right and justify. Only justified text places words individually; everything else is set as one run.
4. Panels
Text on its own is rarely a figure. Frame wraps a block in a padded panel:
from svg_plus import Doc, Frame, Text

doc = Doc(600)
doc.add(Frame(Text(BODY, align="justify")))
doc.save("figure.svg")
The frame measured its child at the width left after its own padding, then drew a box around it. Give it a ground and a border:

"surface" and "rule" are not spellings of a colour — they are names in the theme. Anything that is not a #rrggbb literal is looked up: the six palette roles (ink, muted, accent, surface, rule, page) and five status colours (red, amber, green, blue, grey). Swap the theme later and the whole figure restyles.
5. Side by side
Row puts blocks next to each other and stretches them all to the height of the tallest:
from svg_plus import Doc, Row, card

doc = Doc(600)
doc.add(
    Row(
        card("Networks", "Fibre, mobile and exchange points."),
        card("Silicon", "From design to foundry — the floor of the stack."),
    )
)
doc.save("figure.svg")
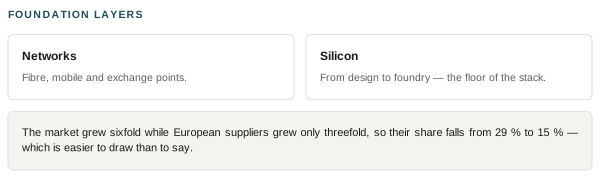
card() is not new machinery: it is a Frame around a Stack of a heading and a paragraph. The two cards come out the same height even though their text does not, because that is what a row does.

By default a row splits its width evenly. weights changes the ratio, and width= on a child claims a fixed column while the rest share what is left:
Row(logo, title, weights=(1, 3))          # a quarter and three quarters
Row(badge, title)                          # even split
Row(Draw(0, paint, width=24), title)       # 24 units, then the rest
6. Stacking, and letting the figure grow
Stack is the vertical counterpart. Doc.add() already stacks what you give it, so you only need Stack inside something else:
from svg_plus import Doc, Frame, Row, Stack, Text, card, eyebrow

doc = Doc(600)
doc.add(
    eyebrow("Foundation layers"),
    Row(
        card("Networks", "Fibre, mobile and exchange points."),
        card("Silicon", "From design to foundry — the floor of the stack."),
    ),
    Frame(Text(BODY, align="justify"), fill="surface", stroke="rule"),
)
doc.save("figure.svg")
Three blocks, one figure, no y anywhere. Add a sentence to either card and everything below it moves down on its own.
7. An arrow between two boxes
Name the blocks you want to join, then connect them. The names are resolved after the layout has run, so the arrow follows the boxes:
doc = Doc(600)
doc.add(
    Row(
        card("Networks", "Fibre, mobile and exchange points.", key="net"),
        card("Silicon", "From design to foundry.", key="si"),
    )
)
doc.connect("net", "si", color="red")
doc.save("figure.svg")
The connector picks which edges to leave from by where the boxes actually ended up: side by side gets a horizontal arrow, stacked gets a vertical one. Lengthen a card and the arrow moves with it.

8. A chart
Bars takes label/value pairs and draws a labelled bar chart:
from svg_plus import Bars

doc.add(Bars([("2019", 20.6), ("2021", 34.5), ("2023", 51.0), ("2024", 61.0)],
              fmt="{:.1f} bn"))
It reserves room for the longest value label, so the chart cannot run out of its own box. Pass top= to fix the scale — necessary whenever two charts are meant to be compared.

9. Emphasis inside a sentence
A Text is normally set in one style. When one word needs its own weight or colour, pass a sequence and mark the piece with a Span:
from svg_plus import Doc, Span, Text

doc = Doc(600)
doc.add(Text([
    "The market grew ",
    Span("sixfold", weight=700),
    ", while European suppliers grew only ",
    Span("threefold", weight=700, fill="red"),
    " — so their share falls from 29 % to 15 %.",
], size=13.0, align="justify"))

A span says only what it changes; everything else is inherited from the paragraph. Each piece is measured in its own style, so the line still justifies exactly — and punctuation stays welded to the word it follows, even when the style changes between them.
10. A logo
Posters need a mark on them. Image embeds the file as a data URI, so the figure stays a single self-contained SVG, and takes its proportions from the image itself:
from svg_plus import Doc, Image, Row, Text

doc = Doc(600)
doc.add(
    Row(
        Image("logo.svg", height=34.0),
        Text("Annual report 2026", size=20.0, weight=700, align="right", wrap=False),
    )
)

SVG, PNG, JPEG, GIF and WebP all work. You give a height; the width follows.
11. Real fonts
So far the figure has used the built-in Helvetica metrics, which work on any machine with no font files. They are approximate: they can run several percent away from the face a browser resolves, and justified lines show it.
For anything you intend to print, load the file the renderer will use:
from svg_plus import Doc, Theme, find_font, load_font

FAMILY = "Source Sans Pro, Helvetica Neue, Helvetica, sans-serif"

theme = Theme(
    body=load_font(find_font("SourceSansPro-Regular"), family=FAMILY),
    bold=load_font(find_font("SourceSansPro-Bold"), family=FAMILY, weight=700),
    italic=load_font(find_font("SourceSansPro-It"), family=FAMILY, italic=True),
    size=11.0,
    leading=1.23,
)

doc = Doc(600, theme=theme)
find_font looks in the usual font directories for a filename stem; load_font reads the metrics through Pillow, which shapes with HarfBuzz. family= is what gets written into the SVG, so you can measure with one file and name a whole fallback stack.
12. Output
doc.save("figure.svg")   # written directly
doc.save("figure.pdf")   # through svglib
doc.save("figure.png")   # needs the [png] extra
doc.svg() returns the markup as a string if you would rather not touch the disk.
Where to go next
- The user guide covers each block properly, plus themes and the drawing escape hatch.
- The developer guide shows how to write a block of your own — it is two methods.
- The
examples/directory in the repository holds fourteen real figures: eight book figures, four marketing posters and two that document svg-plus itself.